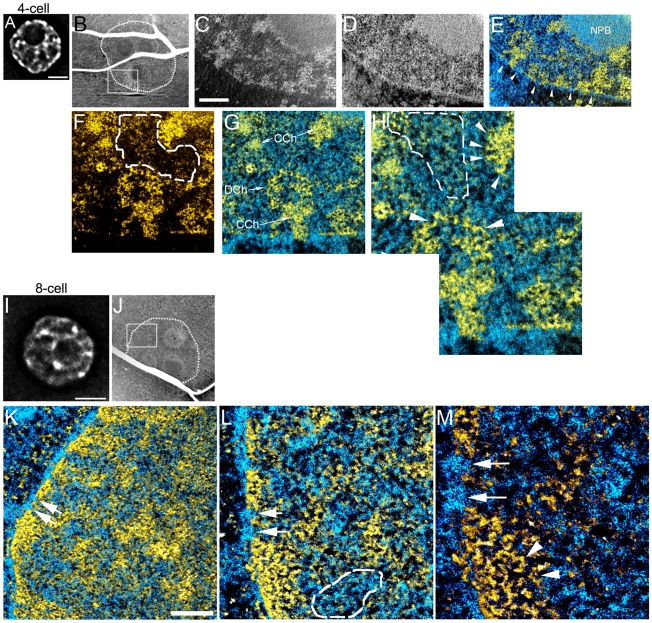
Figure 3. Chromatin becomes highly dispersed into a mesh of 10 nm fibres between four- and eight-cell stage embryos, with high levels of RNPs in the intervening nucleoplasmic space.
(A), Fluorescence image of a DAPI stained nucleus of a four-cell embryo. (B), low magnification mass image of cell from four-cell embryo (nuclear periphery highlighted with dotted line). Field from boxed region (B) showing phosphorus and nitrogen maps (C,D), nitrogen map after phosphorus subtraction merged with phosphorus map (E). Nuclear pores are indicated (arrowheads, E), nucleolar precursor body (NPB). Higher magnification phosphorus map (F) and merged with nitrogen (G) of a field from region shown in C–E. DCh, dispersed chromatin; CCh, compact chromatin blocks. H, higher magnification of a field from region in F,G. Fields delineated with dotted lines (F,H) contain RNP structures, characterized by phosphorus-rich granules, but of a lower phosphorus to nitrogen ratio than chromatin fibres. Arrowheads (H) indicate 10 nm chromatin fibres. (I), Fluorescence image of a DAPI stained nucleus of an eight-cell embryo. (J), low magnification mass image of a cell from eight-cell embryo (nuclear periphery highlighted with dotted line). K, field shown in J of the merge of phosphorus and nitrogen signals. L, high magnification of field in K. Arrows serve as fiduciaries between K, L and M, and also indicate two nuclear pores. Area indicated with dotted lines shows high concentration of RNPs in nucleoplasm (L). M, high magnification of field in L. Arrowheads indicate 10 nm chromatin fibres in compact chromatin region at nuclear envelope. Scale bars in A and I represents 5 µm. Scale bar in C represents 500 nm (C–E), 250 nm (F,G) and 125 nm (H). Scale bar in K represents 500 nm (K), 250 nm (L) and 125 nm (M).

