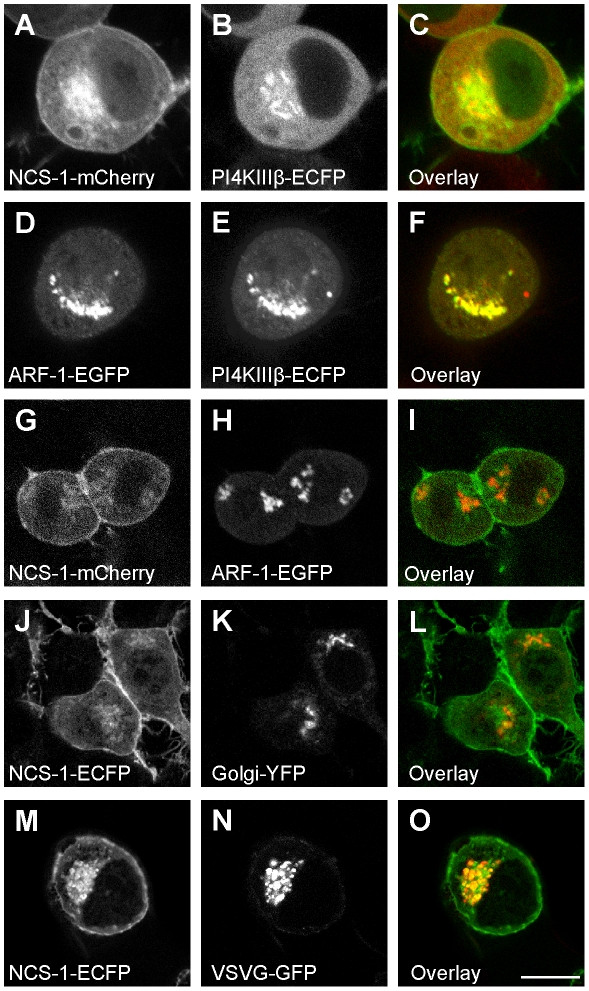
Figure 4. Localisation of exogenously expressed NCS-1 in N2A cells.
N2A cells were transfected to express the indicated constructs and live cells were imaged using confocal microscopy. For the colour overlays (C,F,I,L,O) the images in A,D,G,J and M are in green and those in B,E,H,K,N are in red with co-localisation appearing in yellow. All images were taked form live cells except for those expressing VSVG-GFP which were fixed after transfection and incubation overnight at The scale bars represent 10 µm.

