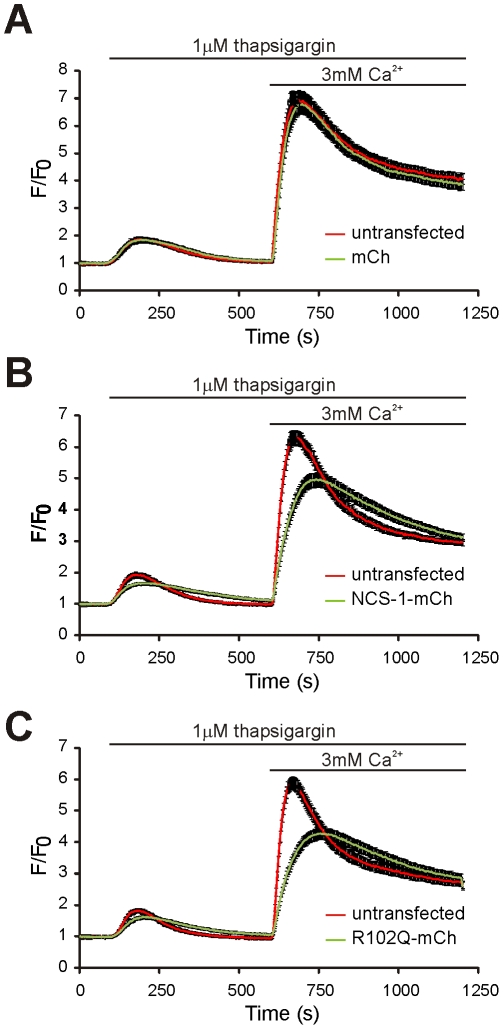
Figure 6. Expression of NCS-1 or NCS-1(R102Q) has similar inhibitory effects on intracellular Ca2+ signals in N2A cells.
N2A cells were transfected to express mCherry from a control vector (A), NCS-1-mCherry (B) or NCS-1(R102Q)-mCherry (C) and loaded with the Ca2+ indicator Fluo4. Changes in Fluo4 fluorescence were monitored over time following addition of 1 µM thapsigargin in the absence of extracellular Ca2+ and subsequent addition of 3 mM Ca2+ to the external medium. Fluorescence values were expressed as a ratio of the starting fluorescence value for each cell and are shown as mean ± SEM (n = 49−61 cells per condition). In each experiment Fluo4 fluorescence was monitored in transfected and adjacent untransfected cells in the same microscope fields for direct comparison.

