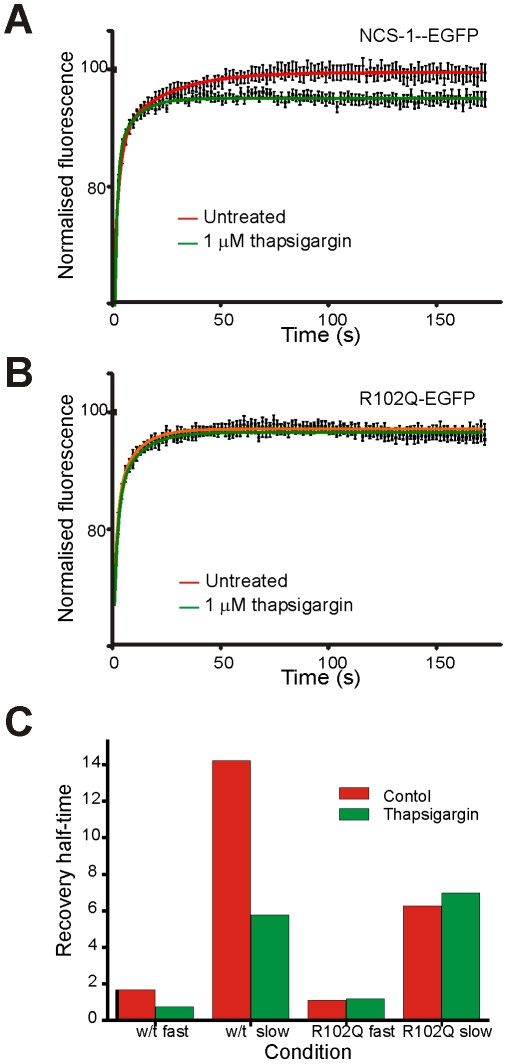
Figure 8. The dynamics of NCS-1 and NCS-1(R102Q) at the plasma membrane in N2A cells and the effects of elevation of intracellular Ca2+ differ.
(A) Cells transfected to express NCS-1-EGFP were subjected to a FRAP protocol in which a region of interest over the plasma membrane was photobleached and the recovery of fluorescence in the same region was monitored over time. Cells were either untreated or were exposed to 1 µM thapsigargin in the presence of 3 mM external Ca2+. Data are shown as mean ± SEM (n = 34 and n = 36 for control and thapsigargin-treated cells respectively. The curves shows the data fitted using non-linear regression to two phase recovery kinetics. (B) Cells transfected to express NCS-1(R102Q)-EGFP were subjected to a FRAP protocol in which a region of interest over the plasma membrane was photobleached and the recovery of fluorescence in the same region was monitored over time. Cells were either untreated or were exposed to 1 µM thapsigargin in the presence of 3 mM external Ca2+. Data are shown as mean ± SEM (n = 38 and n = 40 for control and thapsigargin-treated cells respectively. The curves shows the data fitted using non-linear regression to two phase recovery kinetics. (C) Values for the calculated half-times of recovery from a non-linear regression analysis based on two-phase association kinetics.

