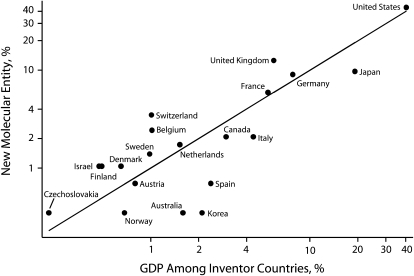
FIGURE 3.
Pharmaceutical innovation as a function of gross domestic product (N = 288): 2000.
Note. GDP = gross domestic product; NME = new molecular entity. Axes are on a log scale. The United States almost falls on the 45 degree line where contribution to GDP and NME development is roughly proportional. Countries above the line develop a higher percentage of drugs compared with their percentage contribution to GDP. For example, the United States accounted for 40% of the GDP among NME innovator countries and was responsible for the development of 43.7% of the NMEs. The UK contributed proportionally more NMEs than its national income would indicate, and Australia and Japan proportionally less.

