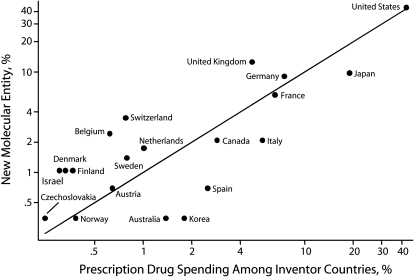
FIGURE 4.
Pharmaceutical innovation (development of NMEs) as a function of prescription drug spending (N = 288): 2000.
Note. NME = new molecular entity. Axes are on a log scale. Countries above the line develop a higher percentage of drugs compared with their percentage contribution to prescription drug spending.

