
Fig.7.
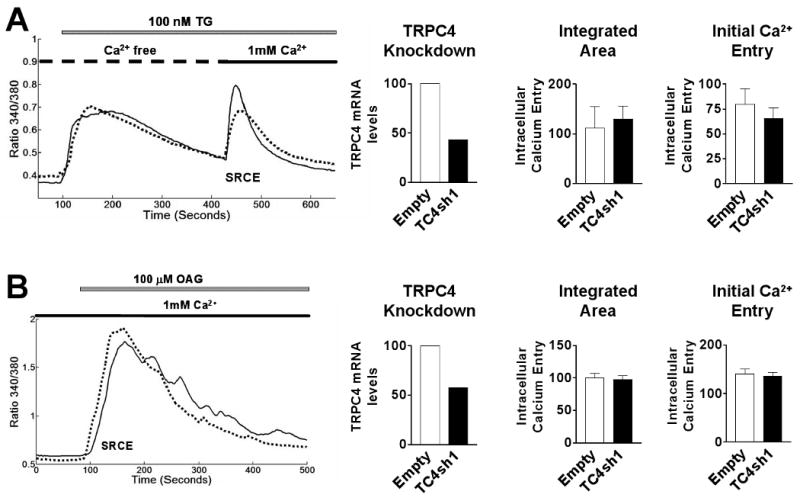
Lack of effect of TRPC4 knockdown on TG- and OAG-stimulated SRCE. Left. SRCE induced by either (A) 100 nM TG and (B) 100 μM OAG in PHM1-41 cells infected with empty adenovirus (solid lines) and cells infected with virus expressing TC4sh1 (dotted lines). Middle. TRCP4 mRNA levels expressed relative to empty vector in the experiment shown. Right: Mean changes in [Ca2+]i resulting from addition of 1 mM extracellular Ca2+ (SRCE) in the experiment shown, calculated as area under the curve (integrated area) and peak height (initial calcium entry) (n=45-55 cells). Data are presented as mean ± S.E.M. and were analyzed by t-test. In all cases, significant differences between groups (p<0.05) are indicated by an asterisk (*). Data are representative of 10 and 7 independent experiments for TG and OAG, respectively.