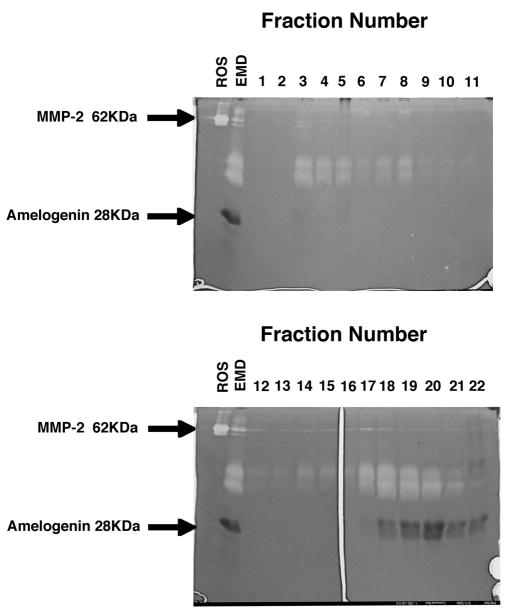
Figure 6. Zymograms of EMD Column Fractions.
Areas in which the collagen was degraded appear clear (unstained). Collagenolytic activity was evident in two areas, fractions 3–8 (top panel) and 17–21(bottom panel). Thus, the collagenolytic activity of EMD was associated with proteins eluting in peak 1 from the sephadex G-100 column, as well as with proteins eluting in the 68 kDa molecular weight region, prior to the elution position of amelogenin. No further collagenolytic activity was apparent in any of the later eluting fractions (data not shown). ROS in lane 1 serves as a standard for collagenolytic activity and is an MMP-2 containing extract prepared from rat osteosarcoma cells. EMD in lane 2 is unfractionated enamel matrix derivative. Lanes 3 – 13 contain the protein eluted from the sephadex G-100 column in fractions 1–11(top panel), and fractions 12–22 (bottom panel).

