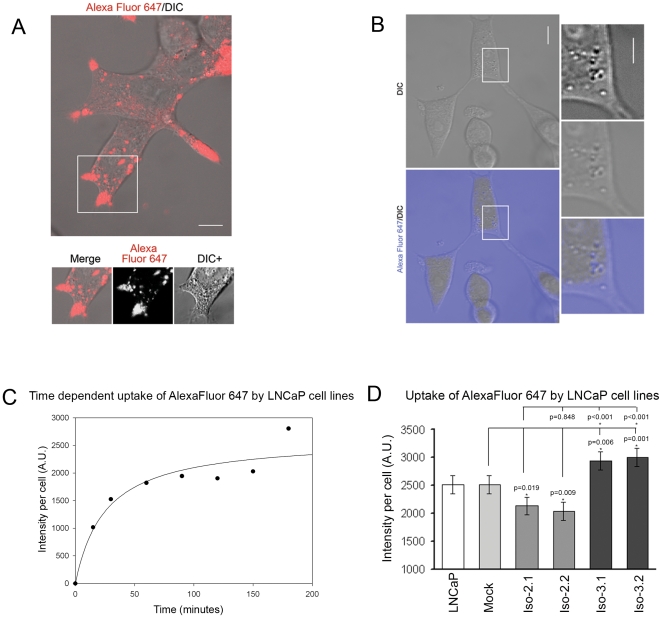
Figure 2. Uptake of Alexa Fluor 647 in LNCaP cells.
A. Live confocal observations of washed cells indicate that Alexa Fluor 647 accumulates in large vesicular structures enriched in cell extensions of LNCaP cells. Representative merged image from DIC and Alexa Fluor 647 channel is presented. Boxed area is presented below. Merge, indicates merged image from DIC and Alexa Fluor 647 channel; Alexa Fluor 647, indicates Alexa Fluor 647 channel; DIC+, indicates DIC channel with enhanced contrast to better visualize vesicular-like structures. Bar, 10 µm. B. Live confocal image of LNCaP cells immersed in cell culture medium containing Alexa Fluor 647. Observations were carried out without removal of Alexa Fluor 647. Representative images from merged DIC and Alexa Fluor 647 channels (lower left panel) and DIC (upper left panel) are presented. Boxed area is presented as enlarged images in right panels: Lower right panel indicates merged image from DIC and Alexa Fluor 647 channels; middle right panel indicates DIC channel; upper right panel indicates DIC with enhanced contrast. Bar, 10 µm. C. Flow cytometric analysis indicates time-dependent uptake of Alexa Fluor 647 in LNCaP cells. Cellular accumulation of the fluorescent marker was determined by flow cytometry at the indicated time points following addition of Alexa Fluor 647 as detailed in Methods (n = 4, error bars ± s.e.m.). D. Quantification of intracellular accumulation of Alexa Fluor 647 following a 2-hour incubation with the dye. LNCaP, LNCaP cell line; Mock, mock transfected cell line; Iso-2.1 and Iso-2.2, isoform 2 expressing cell lines; Iso-3.1 and Iso-3.2, isoform 3 expressing cell lines. For each cell line measurements were performed on triplicate samples; error bars represent ± s.e.m.; Mock, n = 4; LNCaP, Iso-2.1, Iso-2.2, Iso-3.1, and Iso-3.2, n = 7.

