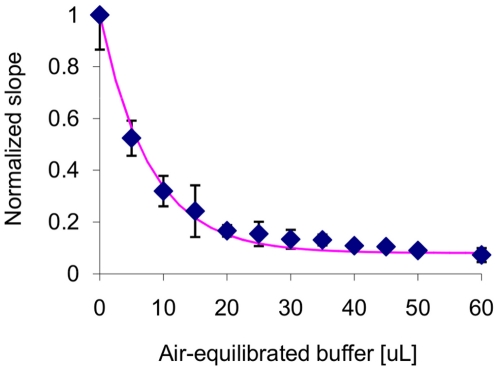
Figure 2. Oxygen deactivation curve for the product of CFPS reactions expressing C. reinhardtii HydA1.
5 µL of CFPS product were diluted with 25 µL of anaerobic Tris buffer before addition of the volume of air-saturated Tris buffer indicated on the x-axis. The slope of methyl viologen absorbance at 578 nm with time for each oxygen-exposed sample was normalized to the slope with no oxygen exposure. The pink curve represents an exponential decay fit to the data. Error bars indicate the standard deviation of triplicate measurements.

