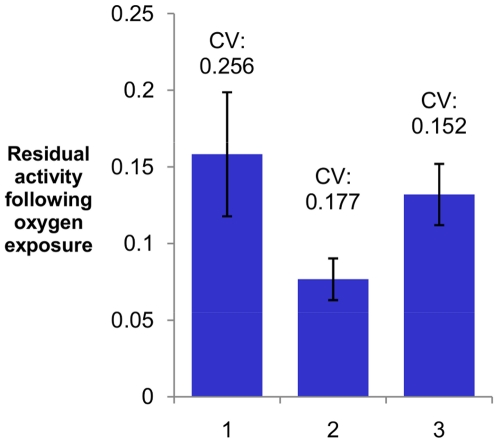
Figure 3. Assessment of the well-to-well error of the screen in three sets of identically performed 10 µL CFPS reactions.
Residual activity following oxygen exposure is represented by the average pre-exposure/post-exposure activity ratio. Error bars indicate the standard deviation for n = 88, 72, and 71 wells respectively. The coefficient of variance is given above each bar. 1 and 5 µL of CFPS product were assayed in the pre-exposure and post-exposure measurements, respectively, and the post-exposure activity was normalized to 1 µL. 15 µL of O2-equilibrated buffer were used for deactivation. C. reinhardtii HydA1 was expressed in Experiments 1 and 2, and C. pasteurianum CpI was expressed in Experiment 3. The difference in average residual activity between Experiments 1 and 2 is likely due to differences in the extent of oxygen diffusion out of the aerobic buffer before addition to the hydrogenase solutions, and highlights the need for wild-type controls on each plate.

