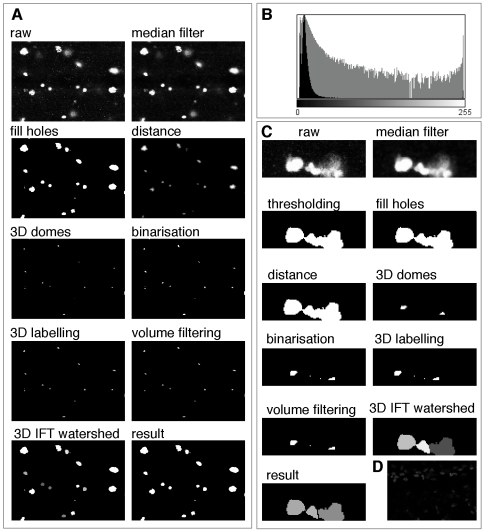
Figure 2. Image processing steps.
(A) Images showing the image processing steps starting from the raw image and finishing in the result, which corresponds to the identified objects (cells). (B) Histogram of a typical pH3 stained image. (C) Higher magnification examples to show, as in (A), the different processing steps. This example shows the power of the programme to separate cells that in some slices may appear to be joined. (D) Example of a faintly stained sample that DeadEasy MitoGlia cannot process and must be discarded.

