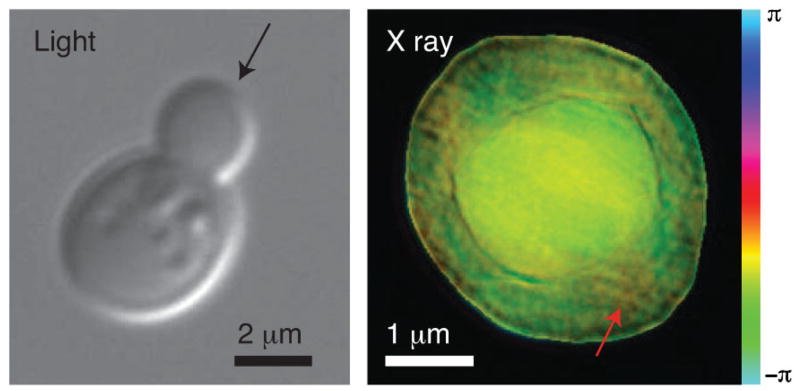
FIG. 2.
(color). Images of Saccharomyces cerevisiae yeast cells. At left is shown a visible light DIC image of a budding yeast taken using a 100× NA = 1.3 immersion objective. The arrow indicates the assumed beam direction for the x-ray diffraction micrograph at right, which is of a different yeast cell. The x-ray diffraction micrograph is a complex wave reconstruction at 0 μm defocus, where the magnitude is represented by brightness and the phase by hue. A possible mitochondrion is indicated with the red arrow.

