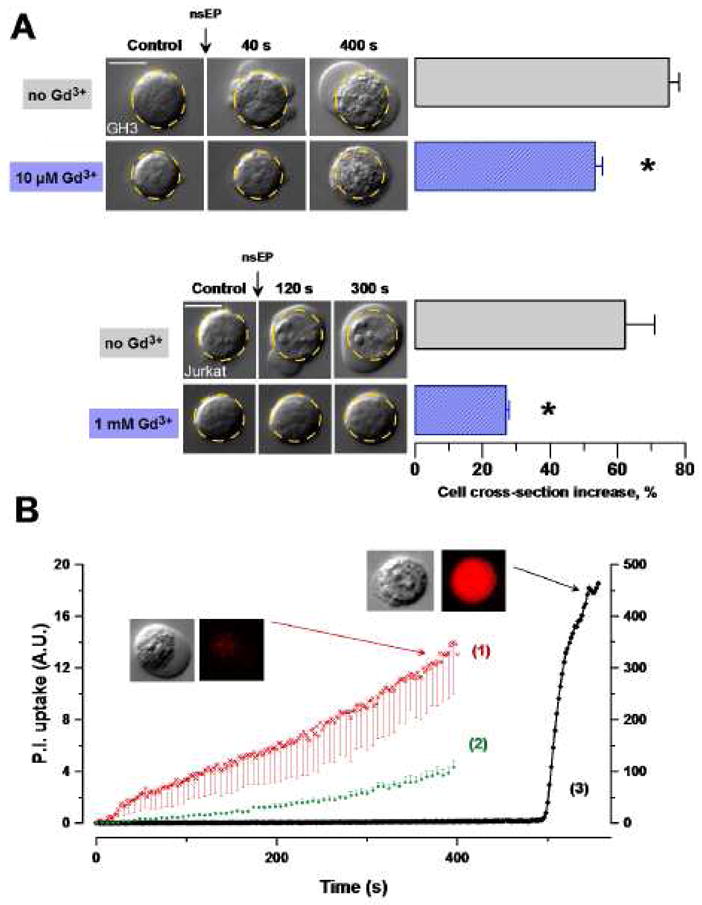
Fig. 2.

Gd3+ reduces nsEP-induced cell swelling and blebbing, and membrane permeabilization to propidium. (A) Representative images of morphological changes in Jurkat and GH3 cells exposed to nsEP (100 × 12kV/cm, 60ns, 2Hz and 20 × 12kV/cm, 600ns, 2Hz, respectively) with or without Gd3+ in the bath buffer. The dashed-line circle is a contour of the cell prior to exposure. Bar graphs display respective mean changes in the cell cross-section as seen on a DIC image (mean ± s.e., n=6 (control) and 9 (exposed) for GH3, and 3 and 5, respectively, for Jurkat; p<0.01 for Gd3+ effect in both cell lines). Calibration bars: 10 μm. (B), Propidium uptake in GH3 cells, (1) after nsEP (n=3), (2) after nsEP + 10 μM Gd3+ (n=4), (3) after permeabilization with 0.03% digitonin at 500 s (n=1). (1) and (2) use left Y-axis and (3) use right Y-axis. nsEP conditions: 20 pulses at 2 Hz, 600 ns, 12 kV/cm, starting at 10 s. Shown are mean values ± s.e.; error bars are one-sided for clarity. Insets show typical DIC and propidium fluorescence images of nsEP- and digitonin-treated cells.
