Fig. 3.
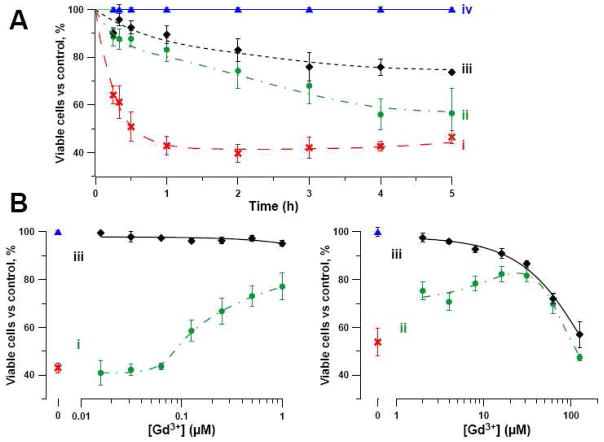
Gd3+ increases survival of nsEP exposed cells. For all panels, cell survival was measured by propidium exclusion by individual cells (Jurkat) using flow cytometry (10,000 cells per sample). Shown are mean ± s.e., n = 3–5. Survival level in control samples (sham exposure, no Gd3+) for the respective time point was taken as 100%. (A): Changes in the viable cell fraction over time after treatment, (i) by nsEP, (ii) by nsEP + 30 μM Gd3+, (iii) by 30 μM Gd3+, (iv) by sham exposure (control). nsEP conditions: 10 × 60 ns at 20 kV/cm. (B): Effect of Gd3+ concentration in the bath buffer on cell survival measured 1 h after nsEP exposure with 30 pulses, 60 ns, 20 kV/cm (i) or 10 pulses, 60 ns, 20 kV/cm (ii) or sham exposure (iii).

