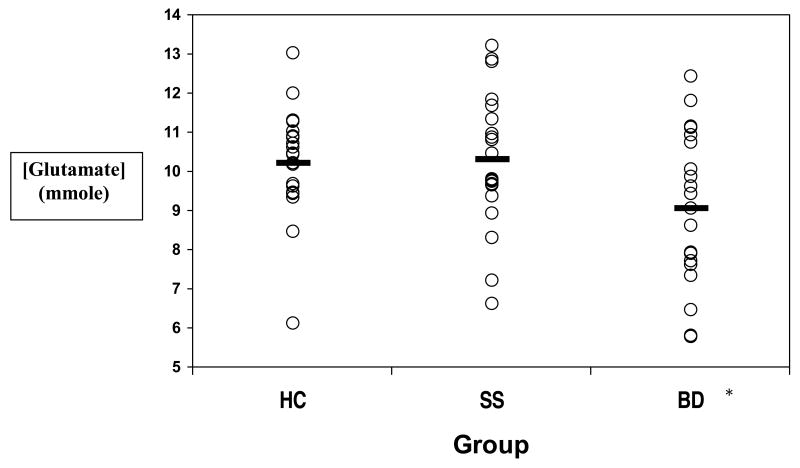
Figure 3.
Comparative absolute glutamate concentrations across groups
Legend: HC=Healthy Controls; SS=High-risk offspring with Subsyndromal symptoms; BD=High-risk offspring with Mania; Overall ANOVA: F=3.08, p=0.05, f=0.32;
* Significant group differences in SS and BD groups [10.30 ± 2.0 (SD) versus 9.08 ± 1.8 (SD); F(1,38)=4.31, p<0.04, (f)=0.27], and between HC and BD groups [10.21 ± 1.4 (SD) versus 9.08 ± 1.8 (SD), F(1,38)=4.30, p<0.04, (f)=0.27]

