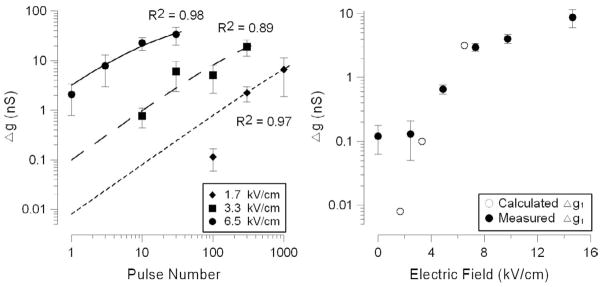
Fig. 6.
Fitting of the experimental data with a model that treats USEP trains as a series of single-pulse exposures with exponentially diminishing efficiency.
The experimental data are the same as shown earlier in Figs. 3 and 4. The best fit lines in panel A are plotted using Eq. (5) using optimized value of α = 0.05 (nS)−1. Panel B shows that Δg1 values obtained by the numerical algorithm are close to the values measured in single-pulse exposure experiments. See text for more detail.

