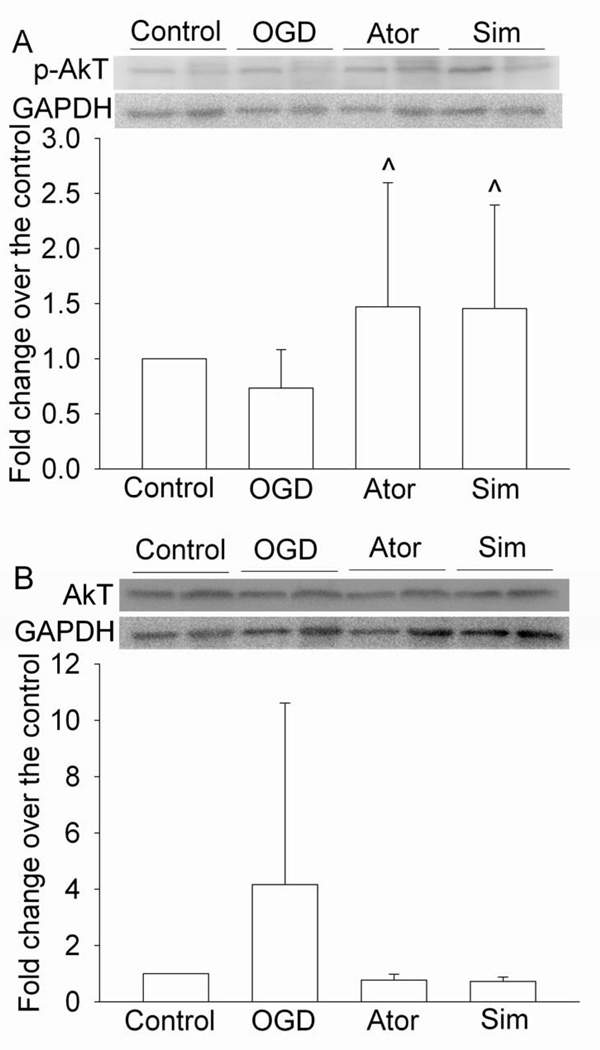
Fig. 8. Increase of the expression of phospho-Akt (p-Akt) by statins.
Bovine pulmonary arterial endothelial cells were exposed to a 5-h oxygen-glucose deprivation (OGD) and 1-h simulated reperfusion. They were posttreated with or without 2 µM simvastatin or 4 µM atorvastatin for 1 h immediately after the OGD. Cells were harvested for Western analysis of p-Akt (panel A) and total Akt (pane B). A representative Western blot is shown in the top panel and the graphic presentation of the p-Akt or total Akt protein abundance quantified by integrating the volume of autoradiograms from 8 separate experiments is shown in the bottom panel. Values in graphs are expressed as fold changes over the control and are presented as the means ± S.D. ^ P < 0.05 compared with OGD only. Ator: atorvastatin; Sim: simvastatin.

