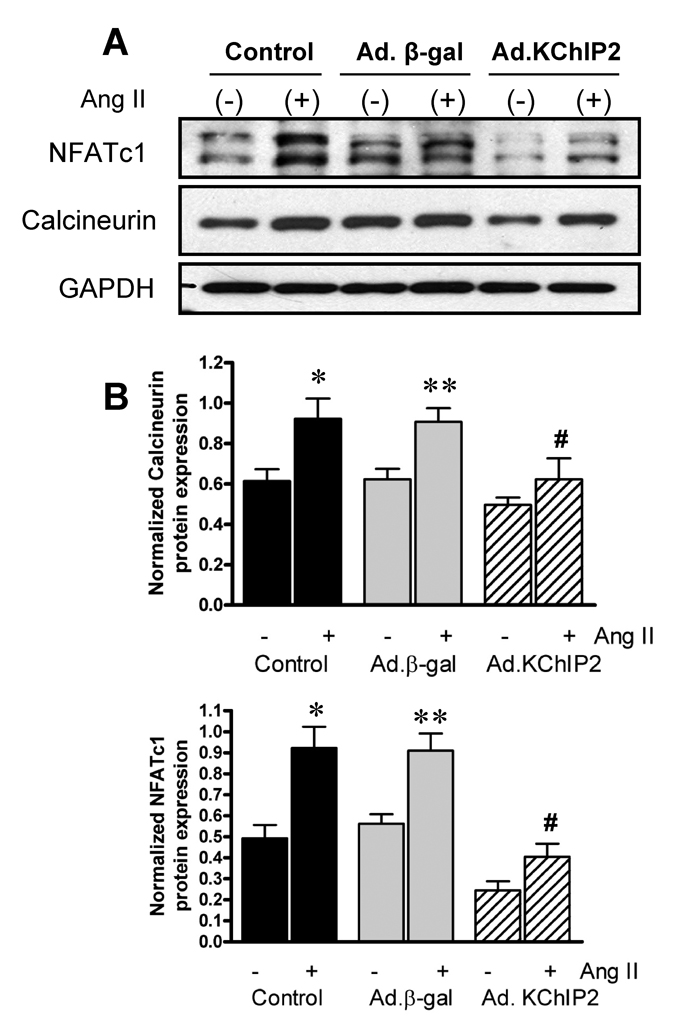
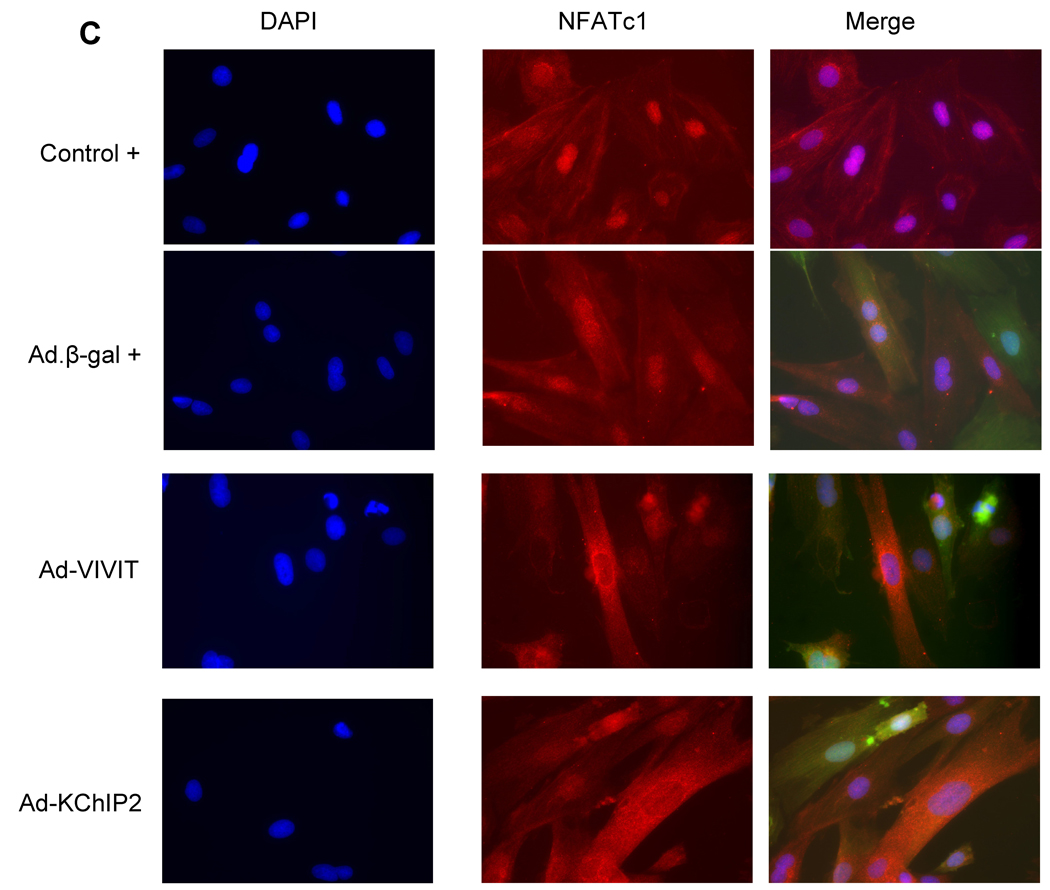
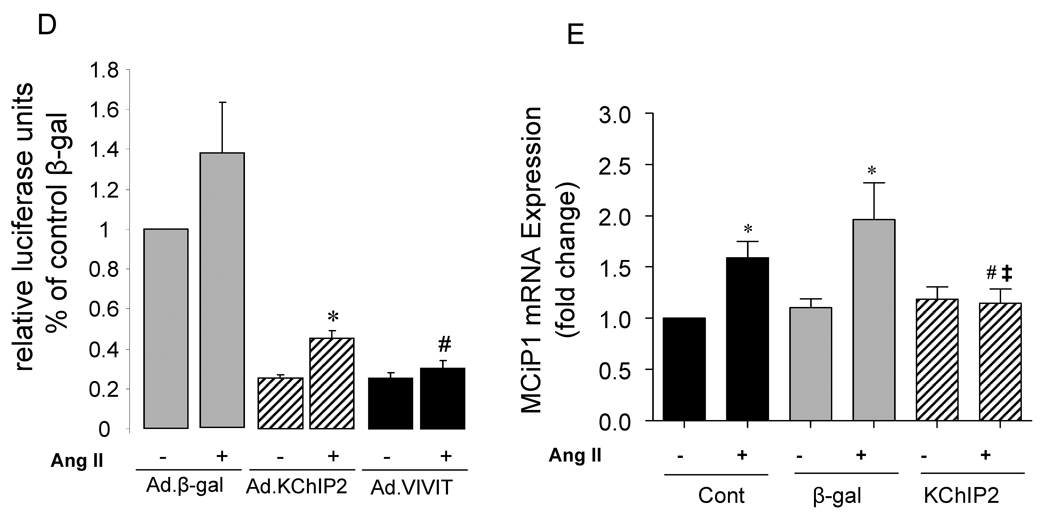
Figure 6. KChIP2 inhibits calcineurin/NFAT pathway.
The effect of KChIP2 on NFATc1 and calcineurin expression (A) was evaluated by Western blotting in neonatal myocytes infected with Ad.β-gal or Ad.KChIP2 (MOI 60) in the presence (+) or absence (−) of Ang II. (B) Quantitative analysis of mean data (± SEM) of 3 to 4 independent experiments. GAPDH, an internal loading control, is used to normalize protein expression. * P< 0.05 Cont+AngII vs. Cont; **P<0.01 Ad.β-gal+Ang II vs. Ad.β-gal; #P<0.01 Ad.KChIP2 vs. Ad.β-gal. (C) Control NRVM non-infected or NRVM infected with Ad.β-gal, Ad.VIVIT (a calcineurin/NFAT-specific inhibitor) or Ad.KChIP2 were stimulated with Ang II (+) for 30 min and analyzed for NFATc1 translocation. Myocyte nuclei are visualized with DAPI staining. (D) NFAT-luciferase activity was measured in NRVM infected with Ad.β-gal, Ad.KChIP2 or Ad.VIVIT in the absence (−) or presence (+) of Ang II (1 µM for 24 hours). Data were normalized to unstimulated β-gal (−AngII). *P=0.021 Ad.KChIP2+AngII vs. Ad.β-gal+AngII; #P=0.014 Ad.VIVIT+AngII vs. Ad.β-gal+AngII. (E) MCiP1.4 mRNA expression was determined by real time-PCR and normalized against GAPDH mRNA in control NRVM and NRVM infected with Ad.β-gal or Ad.KChIP2 and cultured in serum-free medium in the absence (−) or presence (+) of Ang II (1 µM for 24 hours). Density values of corresponding bands from at least six-eight independent experiments were normalized to control unstimulated (−AngII) and are expressed as mean ± SEM. * P< 0.05 Cont+AngII vs. Cont; *P<0.01 Ad.β-gal+AngII vs. Ad.β-gal; #P<0.01 Ad.KChIP2+AngII vs. Ad.β-gal+AngII; ‡P<0.01 Ad.KChIP2+AngII vs. Cont+AngII.


