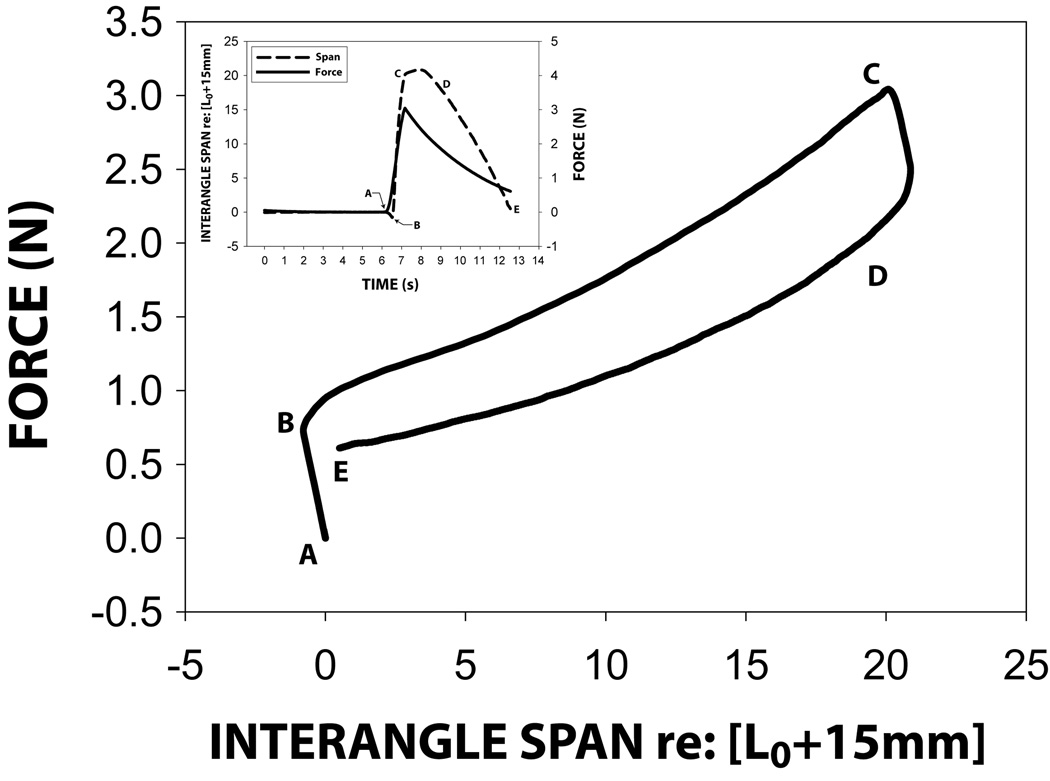
Figure 3.
Typical force-span hysteresis curve sampled from a normal adult subject with graphic insert showing span-time (black line) and force-time (dashed line) plots. Point A: preload condition of the OroSTIFF device on a subject's face; B: onset of interangle stretch phase ; C: peak interangle stretch; the recoil phase (D–E) during which stiffness is calculated (ΔForce/ΔSpan). Regions from A–E and just after C reflect bending (elasticity) of the OroSTIFF device without change in S-DVRT position output.

