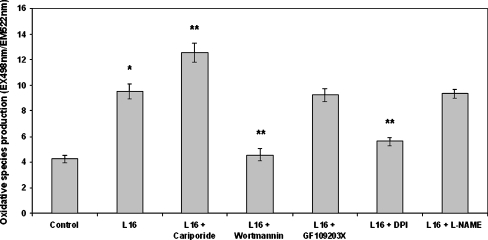
Fig. 3.
Effect of leptin on oxidative species production as measured with the fluorescent probe H2DCFDA. Monocytes were incubated with the inhibitors for 15 min/37 °C followed by incubation with leptin (16 ng/ml) for 30 min/37 °C. The arithmetic means of at least six experiments are shown. Error bars indicate standard deviations. The level of significance of the differences between the samples was calculated by ANOVA with a Student–Newman–Keuls post-test. *P < 0.05 versus the control sample. **P < 0.05 versus the leptin sample. Inhibitor concentrations are mentioned in the “Materials and methods” section

