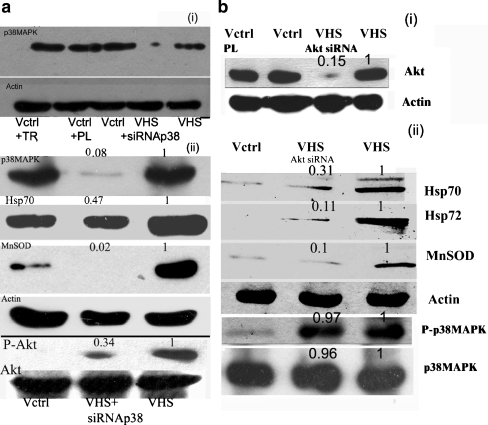
Fig. 4.
Inhibition of the overexpression of Hsp70 and MnSOD induced by heat shock through transfection of siRNA against p38MAPK and Akt. a Exposure to p38MAPK si RNA- (1) Uppermost panel depicts the protein level of p38MAPK. Second panel from top depicts beta actin protein level. (2) Uppermost panel of a series of Western blots depicts the protein level of p38MAPK. Second panel from the top depicts Hsp70. The third panel from the top shows MnSOD levels. The fourth panel from top shows beta actin levels. The fifth panel from top displays phospho-Akt levels. The last panel shows Akt protein levels; Vctrl + TR− control V79 fibroblasts + transfection reagent; VCtrl + PL—Control V79 fibroblasts + Polylinker siRNA; VCtrl- Control V79 fibroblasts; VHS—untransfected V79 fibroblasts treated with single dose heat shock of 43°C for 40 min. VHS + siRNA p38-p38MAPK siRNA transfected V79 fibroblasts treated with single dose heat shock of 43°C for 40 min. b Exposure to Akt siRNA—(1) Upper panel shows Akt protein levels, and second panel depicts actin levels. (2) Upper panel depicts Hsp70, the second panel from top depicts Hsp72, and the third panel from the top shows MnSOD immunoblot. The fourth panel from top shows actin immunoblot. The fifth and sixth panels from the top show phospho-p38MAPK and p38MAPK levels, respectively. VCtrl-control V79 fibroblasts; Vctrl + PL-polylinker siRNA treated control; VHS- untransfected V79 fibroblasts treated with single dose heat shock of 43°C for 40 min. VHS + siRNA Akt -siRNA transfected V79 fibroblasts treated with single dose heat shock of 43°C for 40 min. Details of the experimental procedures are described in the “Materials and methods” section. The numbers above the panels indicate band densities with respect to control bands normalized to 1. The blots are representative of two–three experiments

