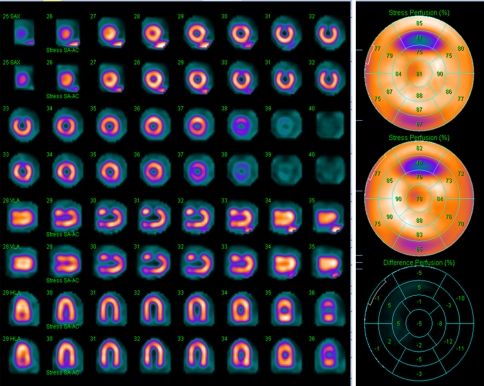
Figure 7.
Images and 17-segment perfusion polar maps and scores of the cardiac insert with two defects: first/top: AC, second/bottom: NC. Defect contrast was visually comparable for the AC and NC images, but the calculated defect contrast was noticeably higher in the AC images for the full defect (AC .628 vs NC .528)

