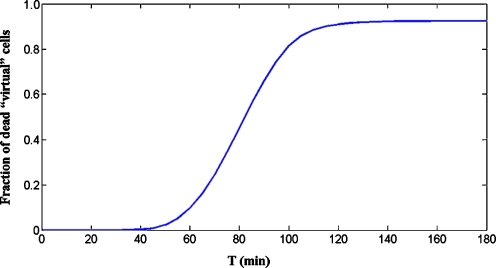
Fig. 3.
Model prediction of the dependence of cell mortality on the time of treatment. The cell population is represented by a set Σ (“virtual” population) consisting of 75,000 models characterized by randomly generated parameter vectors (“virtual” cells), belonging to the same box used for Fig. 2B. For all models in set Σ, the active caspase-3 time responses (x6[k](t) (k = 1,2,…,75,000)) to a persistent stimulus of intensity q = 400 mol/cell/min and of duration Ti = 10, 20,…,180 min were computed. Then, the times tD[k] for which x6[k](t) reaches the threshold x6[k](t) = 5,000 mol/cell were determined. Finally, the number of models for which tD[k] ≤ Ti, say NA(Ti), was computed for all Ti, and the ratios are reported in the figure

