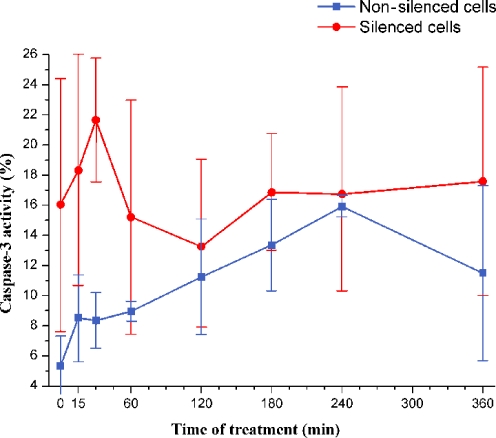
Fig. 6.
Caspase-3 activity in nonsilenced and in BAR-silenced cells. Y axis reports the caspase-3 activity in nonsilenced and in silenced cells evaluated as the percentage of cells treated with Apo2L/TRAIL positive to FITC-DEVD-FMK. On the X axis, the time of Apo2L/TRAIL treatment is reported. The values represent the average of three independent experiments. Bars: one standard deviation. Note that, in order to make clear the comparison between silenced and nonsilenced cells, the definition of caspase-3 activity is different from that used in Fig. 2 (see “Materials and methods”). Time of treatment = 0 means that cells were not treated with Apo2L/TRAIL

