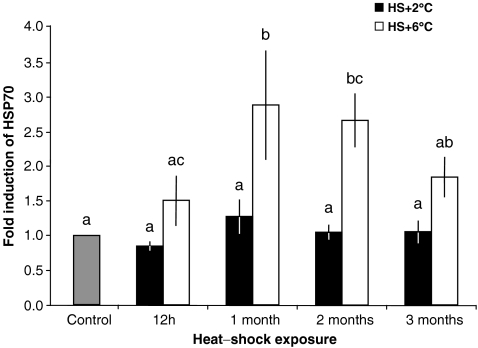
Fig. 4.
Graphical representation of quantitative PCR results. Total RNA was extracted from control and heat-shocked crustaceans, and Nrhe_Chalamont_Hsp70 mRNA expression was analysed with specific probes. Control animals (C; fold induction = 1) were maintained at 10°C over the entire experimental period; treated animals were exposed to 12°C (HS+2°C, black bars) or 16°C (HS+6°C, white bars) for 12 h, 1, 2 or 3 months and returned to 10°C for a 2-h period of post-stress recovery. Plotted data are expressed as fold induction with respect to a sample kept at 10°C (mean ± SD). Each bar represents the mean of six individuals. Different letters above the bars indicate values significantly different from each other (P < 0.05)

