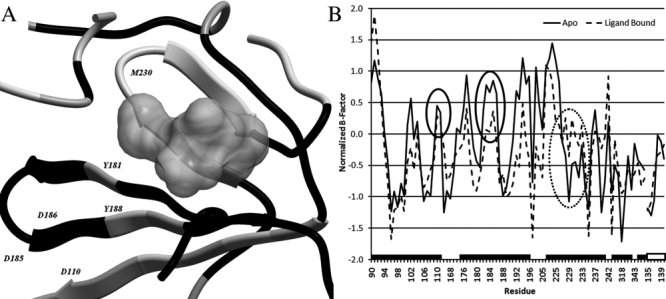
Figure 1.

Changes in average B-factor as a result of ligand binding projected on the backbone ribbon. White residues indicate an increase (≥0.2), gray indicates no change (between 0.2 and −0.2), and black indicates a decrease (≤−0.2) (PDB:1FK9). (A) The gray volume represents the NNRTI Efavirenz. The entire pocket region has a lower average normalized B-factor in the ligand-bound compared to the apo form while the profile remains comparable (B). The catalytic residues undergo a decrease in B-factor (black circles), while the primer grip region containing residue W229 and M230 undergoes an increase upon ligand binding (dashed black circle). The black bars on the horizontal axis indicate continuous residues, the white filled bar indicates the residues on the p51 subunit. Each tick marks a separate residue the precise residue numbers can be found in the materials and methods, p66 and p51 have been separated by a gap.
