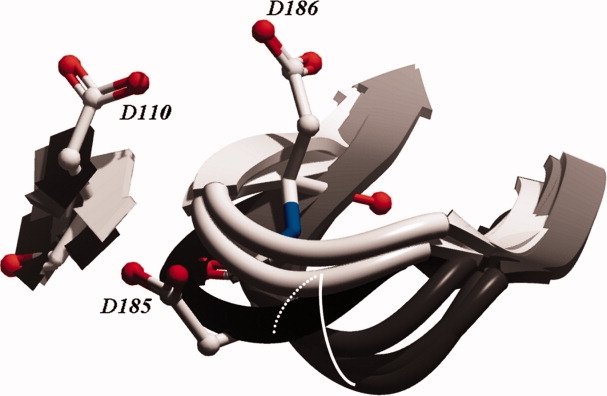
Figure 3.

Overview of the changes occurring at the catalytic site as a result of DNA binding (three gray ribbons), NNRTI binding (two black ribbons) compared with the apo position (two white ribbons). The three aspartic acids that are visible are part of the DNA bound conformation (1RTD). In the apo structures, these residue side chains are placed similarly, however in the NNRTI bound structures D186 points toward D110, D110 points outward, and D185 points downward. Upon DNA binding, the loop containing the residues moves along the path indicated by the white curve, in the presence of an NNRTI the loop moves along the path indicated by the dashed white curve.
