
Figure 3.
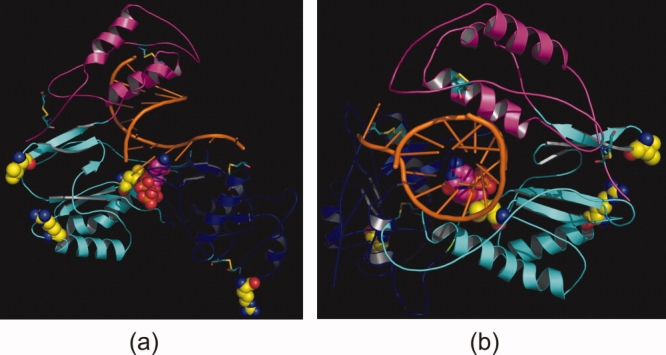
The HBV polymerase is shown as a ribbon diagram (a and b show two different orientations) with the fingers (rt1–49 and rt90–rt172), palm (rt50–rt89 and rt173–rt267), and thumb (rt268–rt351) subdomains in pink, cyan, and blue, respectively. The bound double-stranded DNA template primer is shown as a stick model in orange ribbon mode, and dCTP is in magenta (with P, N and O atoms in orange, blue and red, respectively). The four proposed disulfide links are represented by stick models. The four residues present in the disallowed region in the Ramachandran plot are shown in yellow space-filling model. [Color figure can be viewed in the online issue, which is available at http://www.interscience.wiley.com.]