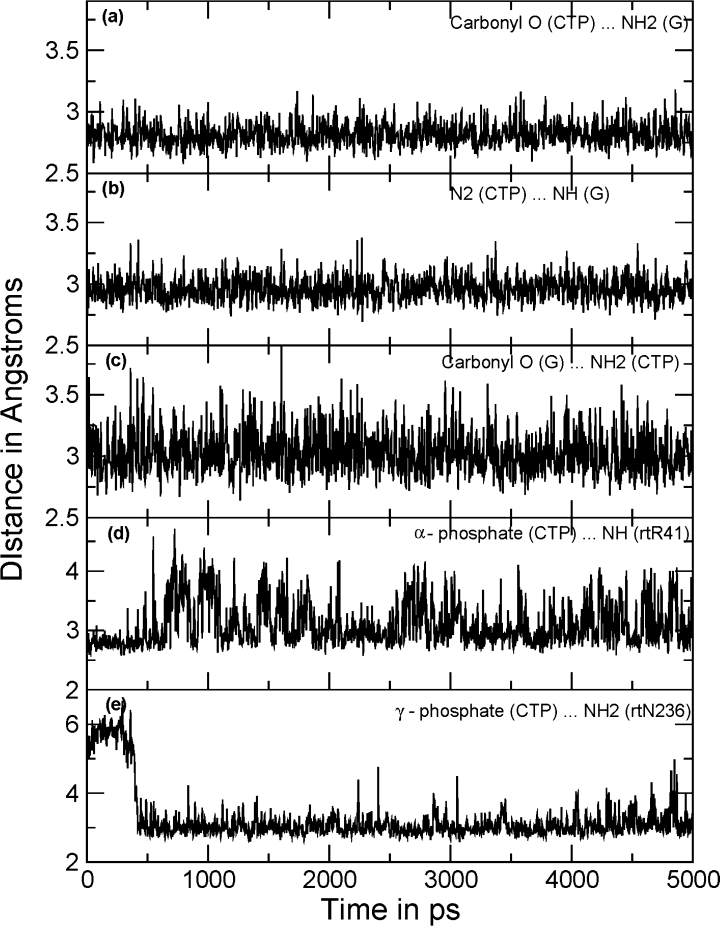
Figure 7.

Distance plots between the hydrogen bonding atoms. All the distances shown in the figure are between heavy atoms (O…N or N…N). Three hydrogen bonds between the C:G pair were retained throughout the simulations showing 100% occupancy: (a) between carbonyl O (CTP) and NH2 of G; (b) between N2 of CTP and NH of G; (c) and between NH2 of CTP and carbonyl O of G. Panel (d) shows variations in distance between the α-phosphate of CTP and the terminal guanidine group of rtR41. (e) The residue rtN236 was distant in the beginning of the MD simulation; loop movement pushed the side-chain amide toward the γ-phosphate of CTP as depicted.
