
Figure 8.
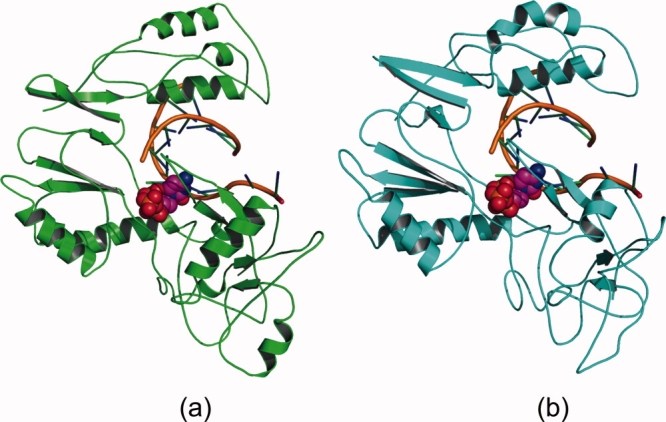
Cartoon picture of overall fold of the homology model (a) before (green) and (b) after ∼4.5 ns (cyan) of the 5 ns MD simulation. Ligand is shown in space-filled mode in the active site. [Color figure can be viewed in the online issue, which is available at http://www.interscience.wiley.com.]