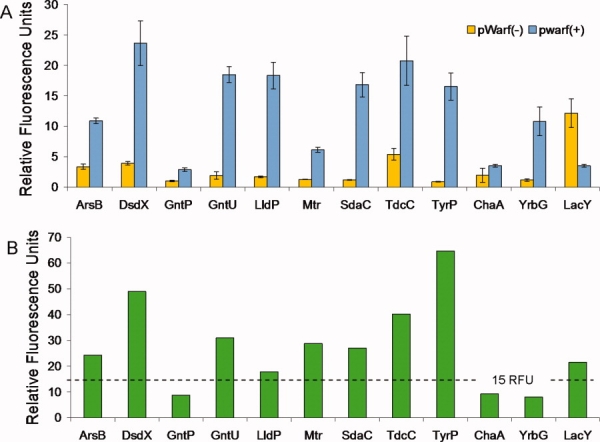
Figure 2.

Whole cell fluorescence measurements from expression in pWarf vector system. A: Each test protein was expressed in the pWarf(−) and pWarf(+) vectors using standard conditions (LB, 0.5 mM IPTG, 4 h induction) and the fluorescence values relating to expression are shown in yellow and blue, respectively. The standard deviation was calculated from the triplicate measurements and shown as error bars. B: For each test protein, the appropriate expression vector was selected and subjected to an optimization screen to increase expression. The fluorescence values relating to optimized expression are shown in green. From left to right, the first eleven proteins have a predicted Cout topology, and the rightmost protein, LacY, has Cin topology. The dashed line indicates the 15 RFUs criterion for protein purification. [Color figure can be viewed in the online issue, which is available at http://www.interscience.wiley.com.]
