
Figure 2.
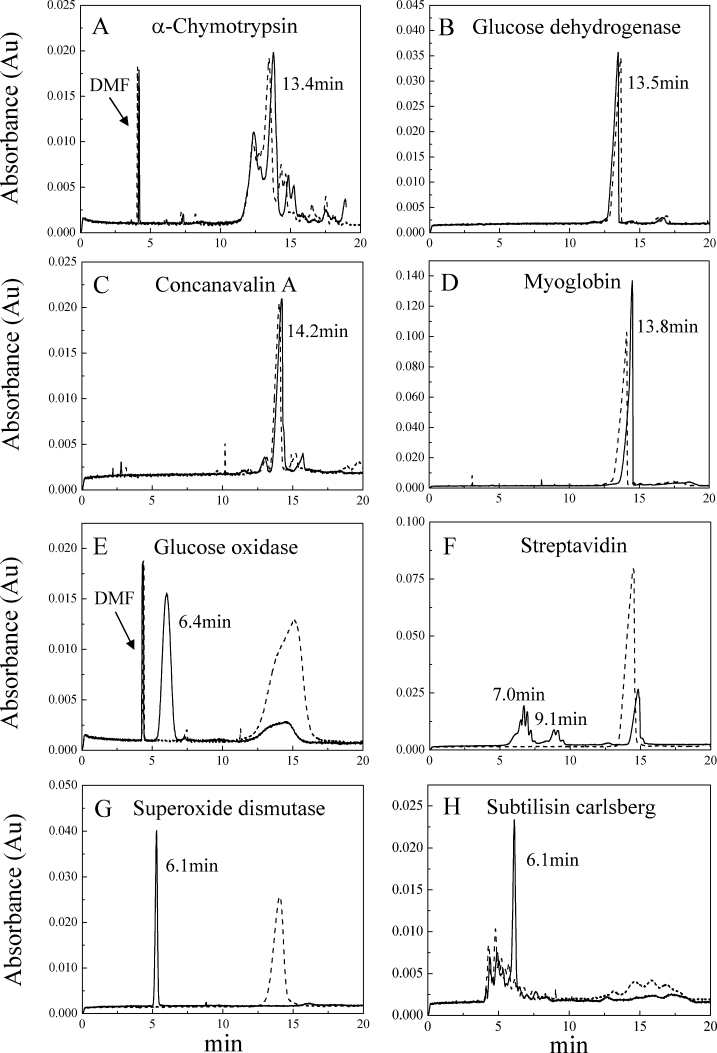
Electropherograms showing the migration of unboiled and boiled samples of non-KSPs (A–D) and KSPs (E–H). Black solid lines and dash lines represent the data of samples incubated in SDS that were not boiled or boiled, respectively. Samples were incubated in 20 mM sodium phosphate buffer (pH 7.4) containing 1% (w/v) SDS for 10 min. The electropherograms of unboiled and boiled non-KSPs showed little difference, but unboiled KSPs had significantly faster migration.