
Figure 2.
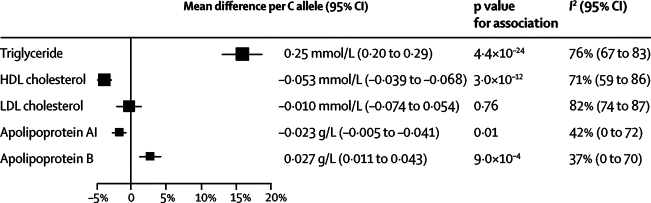
Association of APOA5 −1131T>C with circulating lipid concentration per C allele
Size of data markers is proportional to the inverse of the variance of the weighted mean difference, and the horizontal lines represent 95% CIs. To enable comparison of associations across lipids and apolipoproteins, associations are presented as percentage differences (calculated in reference to the weighted mean of each marker in common homozygotes).