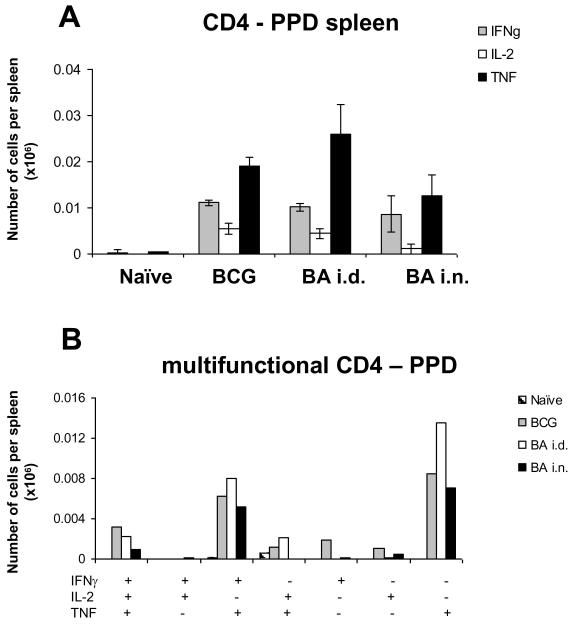
Figure 3. Cytokine responses of splenic T cells to PPD.
Mice were primed with BCG and boosted with Ad85A either intradermally (BA i.d) or intranasally (BA i.n.). Splenocytes were isolated 4 weeks after the boost and stimulated with PPD for 6 hours. The frequencies of IFNγ, IL-2 and TNF producing cells were determined by flow cytometry on CD4 (A) gated cells and total numbers of cells per organ calculated. The number of cells expressing each of the seven possible combinations of the cytokines is shown for CD4 (B) cells. CD8 responses are very low and not shown. Results are expressed as the mean +/− SEM of three mice per group, representative of two independent experiments.

