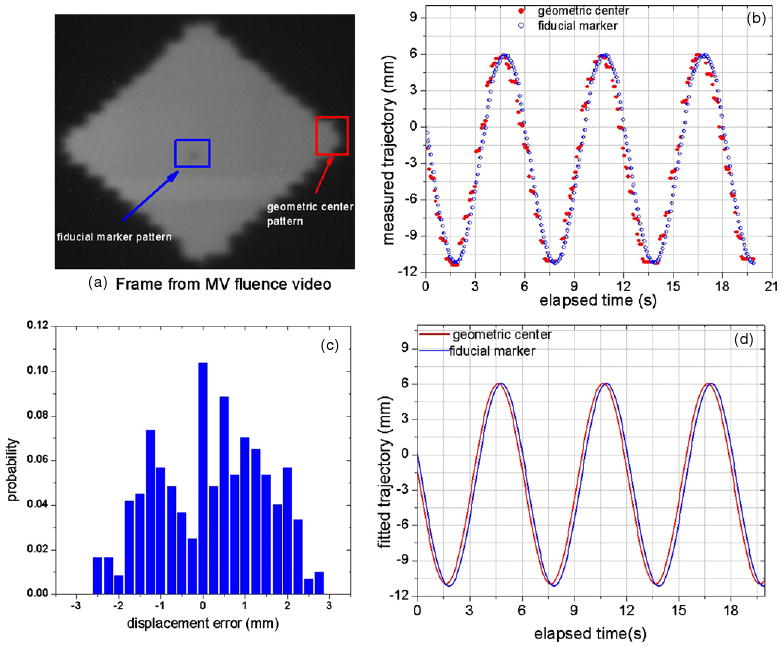
Figure 3.

Quantifying system latency from the acquired tracking portal video. (a) A frame from the video with marker ROI and an edge ROI used as marker and geometric center templates, respectively. (b) The acquired trajectories as a function of elapsed time. (c) The probability distribution derived from a histogram of the variation of the measured trajectories. (d) The fitted curves for the geometric center and fiducial marker. The average system latency (172 ms) was derived from the phase difference between the two curves in (d).
