
Figure 3.
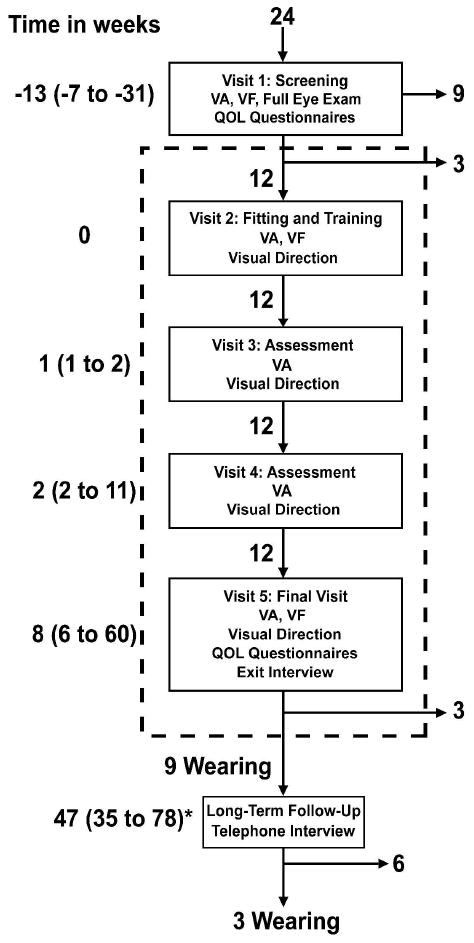
Study flow diagram showing the timing of visits, the main procedures at each visit and the number of patients attending each visit. Numbers on the left of the flow diagram are the median time in weeks (range in parentheses) relative to the Trifield glasses fitting and training visit (visit 2), except for the follow-up visit, which is relative to the study end (visit 5). Numbers next to the down pointing arrows within the dashed box indicate the number of patients moving to the next stage of the study. The numbers next to right pointing arrows outside of the dashed box indicate the number of patients who discontinued wear of the Trifield glasses at that stage. The formal visits of the study are enclosed by the dashed rectangle. VA = visual acuity; VF = visual field as measured by computer perimetry. The * indicates that the reported times are relative to visit 5.