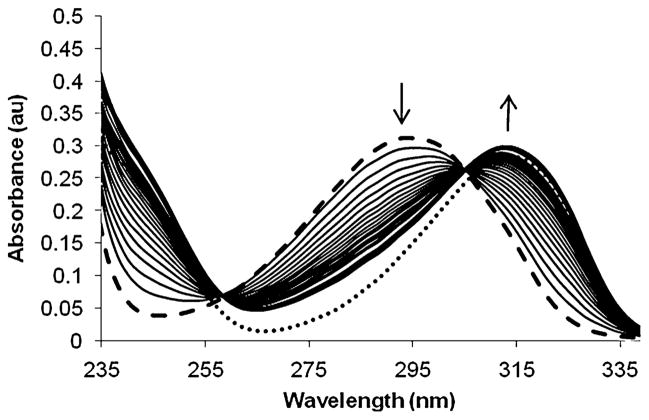
Fig. 2.
Absorption spectra of the glucose-protected ZBG 2 (0.05 mM, HEPES buffer, pH = 7.5) in the presence of β-glucosidase (16 U) monitored over time. The heavy lines are the initial (dashed) and final (solid) spectra and arrows indicate the change in spectra over time. The spectrum of an authentic sample of ZBG 1 (dotted) is also shown.

