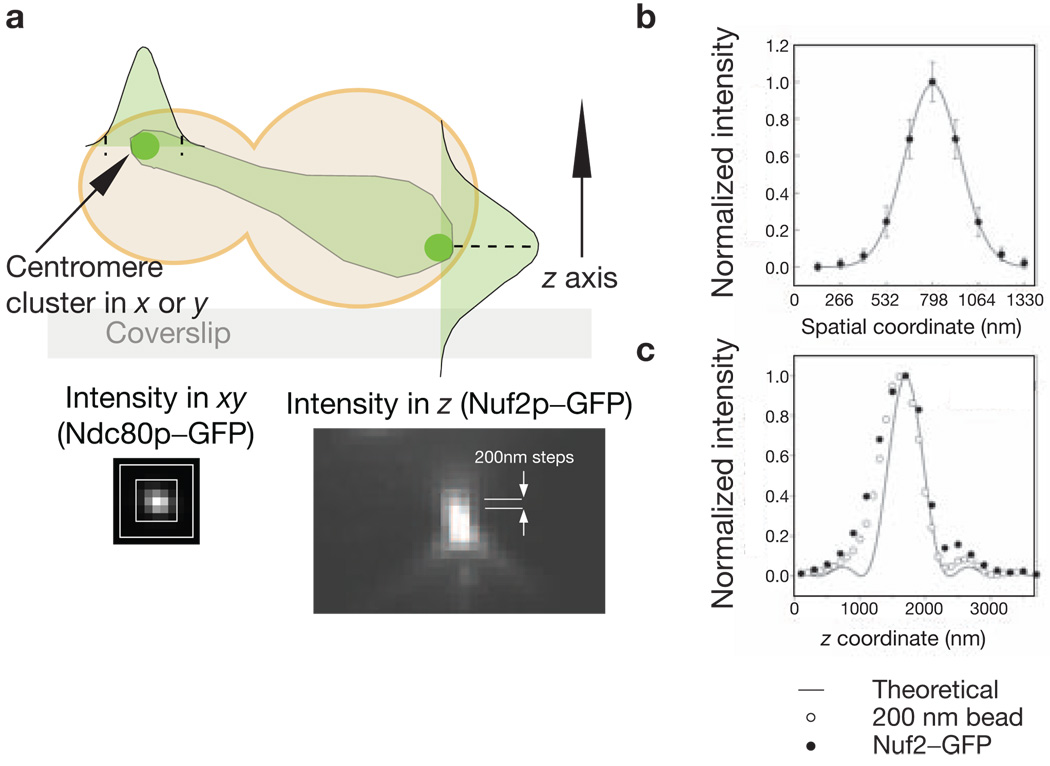
Figure 2.
Characterization of the intensity distribution of a kinetochore cluster. (a) A schematic representation of a budding yeast cell expressing a GFP-tagged kinetochore protein in anaphase–telophase is shown. Signal was measured by integrating the signal intensity in the xy direction (shown for Ndc80p–GFP) in the plane that contains the maximum intensity pixel along the z axis (shown for Nuf2p–GFP). (b) Fitting a Gaussian function to the anaphase–telophase intensity distribution in the xy plane for Nuf2p–GFP yields σ = 159 nm (s.d. for the Gaussian curve). Similar measurement for metaphase xy intensity distribution yields σ = 189 nm. (c) The intensity distribution along the z axis for a Nuf2p-GFP cluster and a 200 nm green fluorescent bead. The solid line represents the theoretical intensity distribution along the z axis.

