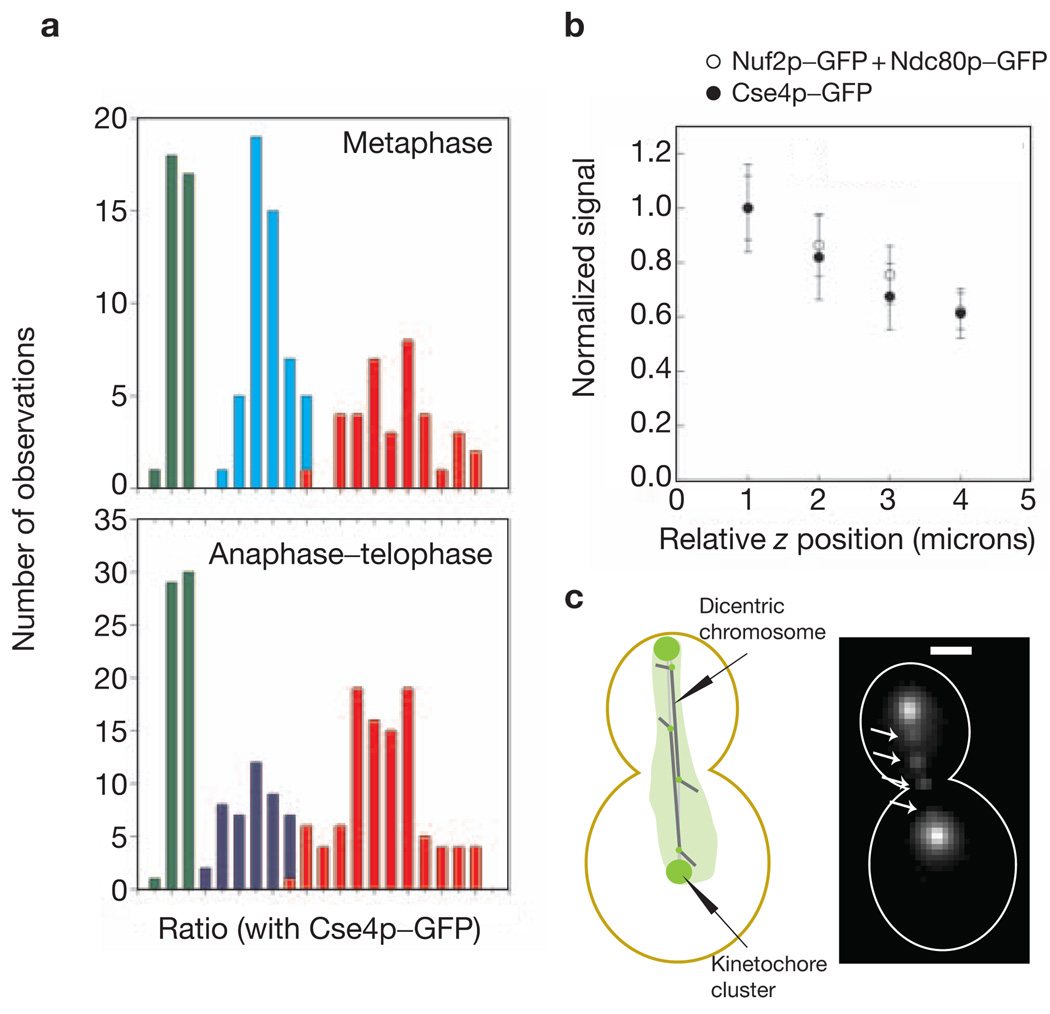
Figure 3.
Linearity and sensitivity of the measurement technique. (a) A frequency histogram for signal measurements in metaphase and anaphase–telophase for Cse4p–GFP (green), Nuf2p–GFP (cyan), Ndc80p–GFP (blue) and Nuf2p–GFP + Ndc80p–GFP (red). The proportional increase in the fluorescence intensity for Nuf2p–GFP + Ndc80p–GFP also demonstrates that the proximity of fluorophores does not detectably affect their fluorescence. (b) Normalized signal plotted as a function of the relative z coordinate of the kinetochore clusters of Cse4p–GFP and Nuf2p–GFP + Ndc80p–GFP. The error bars represent the s.d. of the mean signal value in each bin. (c) Four lagging kinetochores (arrows, Nuf2p–GFP) on the two dicentric chromosomes in a mid-anaphase cell. The chromatin between the two centromeres is 40 kb long. The scale bar represents 2 µm.

