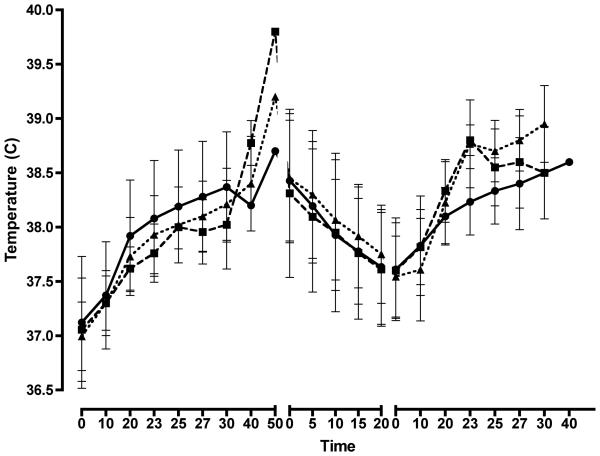
Figure 4.
Core body temperature response during exercise in TPC before rest and rehydration (left segment), during rest and rehydration (middle segment), and during a bout of work after (right segment). Data present as mean ± SD for sport drink (square), IV (triangle), and water (circle). Core temperature increased during exercise and partially recovered during rehab. Bout 1 stop and Bout 2 stop did not differ. Data did not differ by rehydration fluid.

