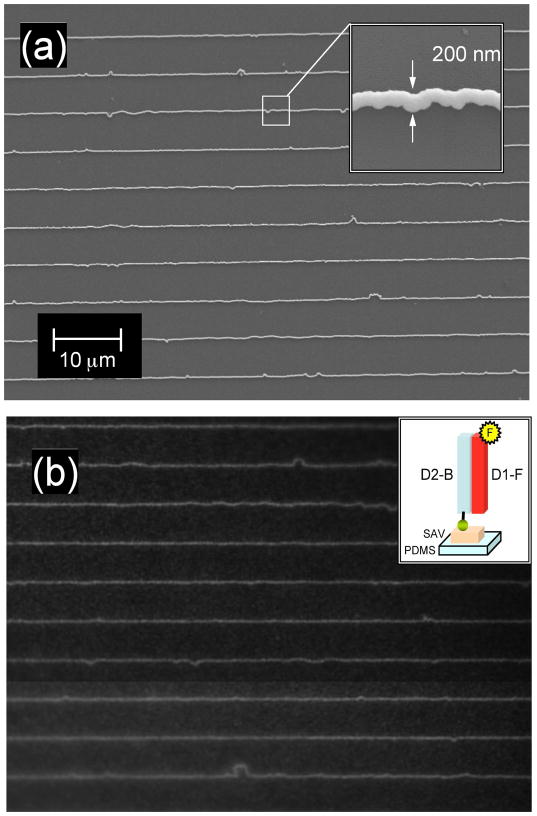
Figure 2.
SEM image of a gold nanowire array master and fluorescence image of DNA nanolines on PDMS replica. (a) A representative large area scan showing a portion of gold nanowire array with average spacing of 5 μm. The inset is a high-magnification image of a single gold nanowire with an average width of 200 nm. (b) A 60x fluorescence image of the PDMS replica surface obtained after the master-replica transfer process and exposure to D1-F, a fluorescently labeled ssDNA complementary to D2-B. The inset is a schematic diagram of the replica surface.

