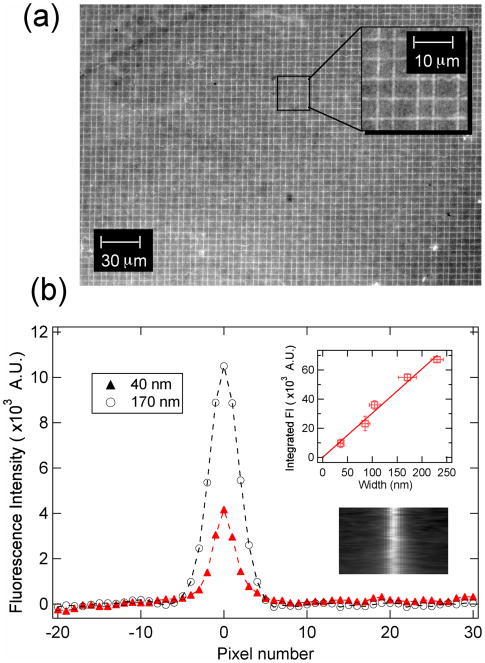
Figure 3.
Fluorescence image and fluorescence measurements. (a) A 20x fluorescence image of a PDMS replica that was stamped in perpendicular directions and then exposed to fluorescently labeled complementary ssDNA, D1-F. (b) Two representative line profiles of the fluorescence intensity that were obtained from two different samples of dsDNA nanolines created from masters with average nanowire width of 40 nm and 170 nm. The inset plot is the integrated fluorescence intensity of line profiles obtained from five different samples of dsDNA nanolines created from masters with gold nanowire widths varying from 40 to 250 nm. The widths of the master gold nanowires were obtained by SEM measurements. (Note: 10 pixels in the fluorescence image ≈ 1.6 μm.)

