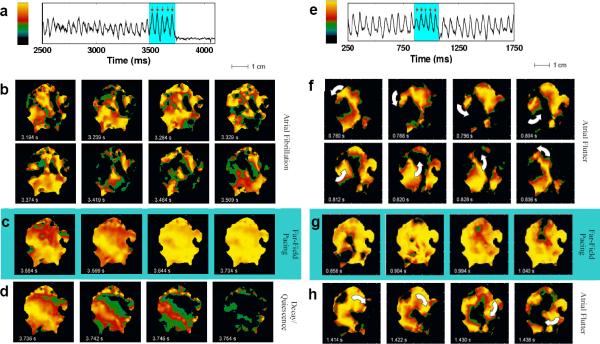
Figure 1.
Successful and unsuccessful termination of AF. a. Optical signal from one pixel during AF showing successful defibrillation after delivery of five far-field pulses of 1.4 V/cm at a cycle length of 45 ms (red arrows). b. Optical signal during fibrillation; color represents voltage (see color bar in panel a). Frames are 45 ms apart in time and show the complex wave patterns during fibrillation. c. Effects of shocks #1, 2, 3 and 5 (left to right), with the first two panels showing partial capture and the last two showing global capture. d. Evolution to full repolarization and quiescence following shock #5. e. Optical signal from one pixel during atrial flutter showing unsuccessful defibrillation after five field pulses of 0.9V/cm at a cycle length of 45 ms (red arrows). f. Optical signal showing a spiral wave rotating counter-clockwise before the shocks. g. Partial capture by shocks #1, 2, 4 and 5 (left to right). h. Shock-induced conversion of the original spiral wave into a spiral wave rotating clockwise. Throughout, light blue shading indicates time during applied shocks.

