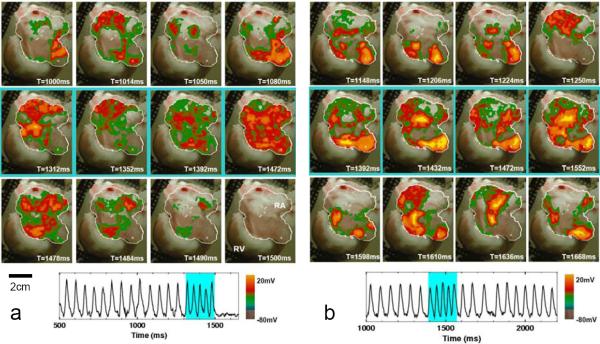
Figure 2.
Successful and unsuccessful termination of atrial fibrillation. a. Successful termination. Top row: AF (dominant period = 59 ms) preceding FF-AFP. Middle row: shocks #1, 2, 3, and 5 in a series of 5 electric field pulses 40 ms apart (1.63 V/cm, 5 ms duration). Tissue area captured progressively increases. Bottom row: return to quiescence following the last pulse. Trace shows optical signal from one pixel (white cross in the above panels, lower right) before, during, and after FF-AFP. Light blue shading indicates time during applied shocks. b. Unsuccessful termination. Top row: AF (dominant period = 60 ms) preceding FF-AFP. Middle row: shocks #1, 3, 4, and 5 in a series of 5 electric field pulses 40 ms apart (1.40 V/cm, 5 ms duration). Not enough tissue is captured by the last pulse to terminate the arrhythmia. Bottom row: return to AF. Trace shows optical signal from one pixel (white cross in the above panels, lower right) before, during, and after FF-AFP. Light blue shading indicates time during applied shocks.

