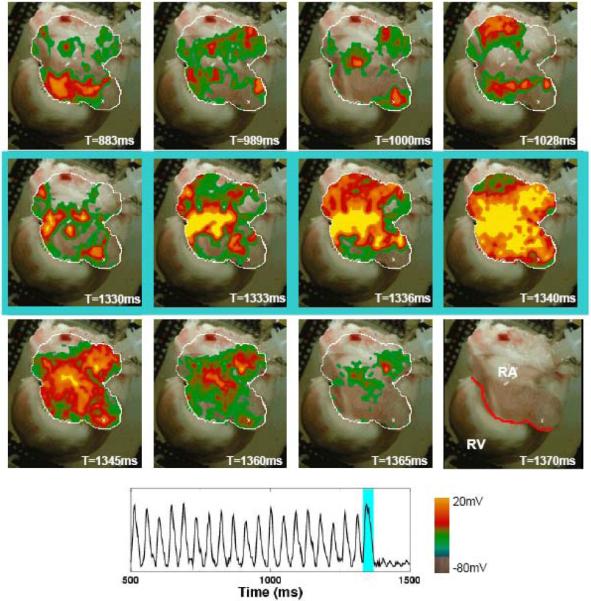
Figure 4.

Successful termination of AF using a single high-voltage pulse. Top row shows AF preceding application of a single electric field pulse (3.73 V/cm, 10 ms duration), which successfully captures the entire tissue (middle row). Bottom row shows quiescence following the pulse. Trace shows optical signal from one pixel (white cross in the above panels, lower right) before, during, and after FF-AFP. The last panel indicates tissue geometry, with the red line separating the right atrium from the right ventricle. Light blue shading indicates time during applied shock. Same preparation as Figure 3 (2 μM ACh).
