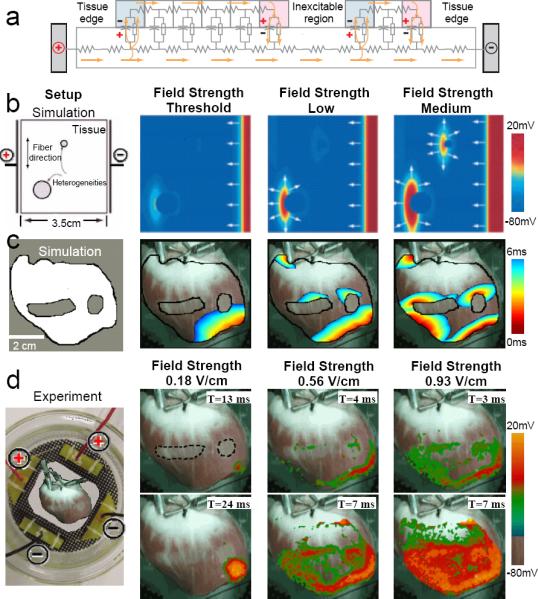
Figure 5.

Mechanism of activation site formation. a. Schematic circuit representation of cardiac tissue with an inexcitable obstacle using the bidomain model. Current injected by the positive electrode produces regions of hyperpolarization (blue) and depolarization (red). b. Idealized simulated cardiac tissue with conductivity discontinuities created by two inexcitable obstacles. With increasing field strengths, first the tissue edge, then a single conductivity discontinuity, and finally both conductivity discontinuities are excited. Spatial resolution is 250 μm. c. Realistic simulated cardiac tissue with two inexcitable obstacles. As in b, increasing the field strength recruits more conductivity discontinuities as virtual electrodes. Spatial resolution is 100 μm. d. Experimental preparation with two inexcitable obstacles created by cryoablation shown with a dotted line (geometry as in c). Increased field strengths progressively activate more tissue.
