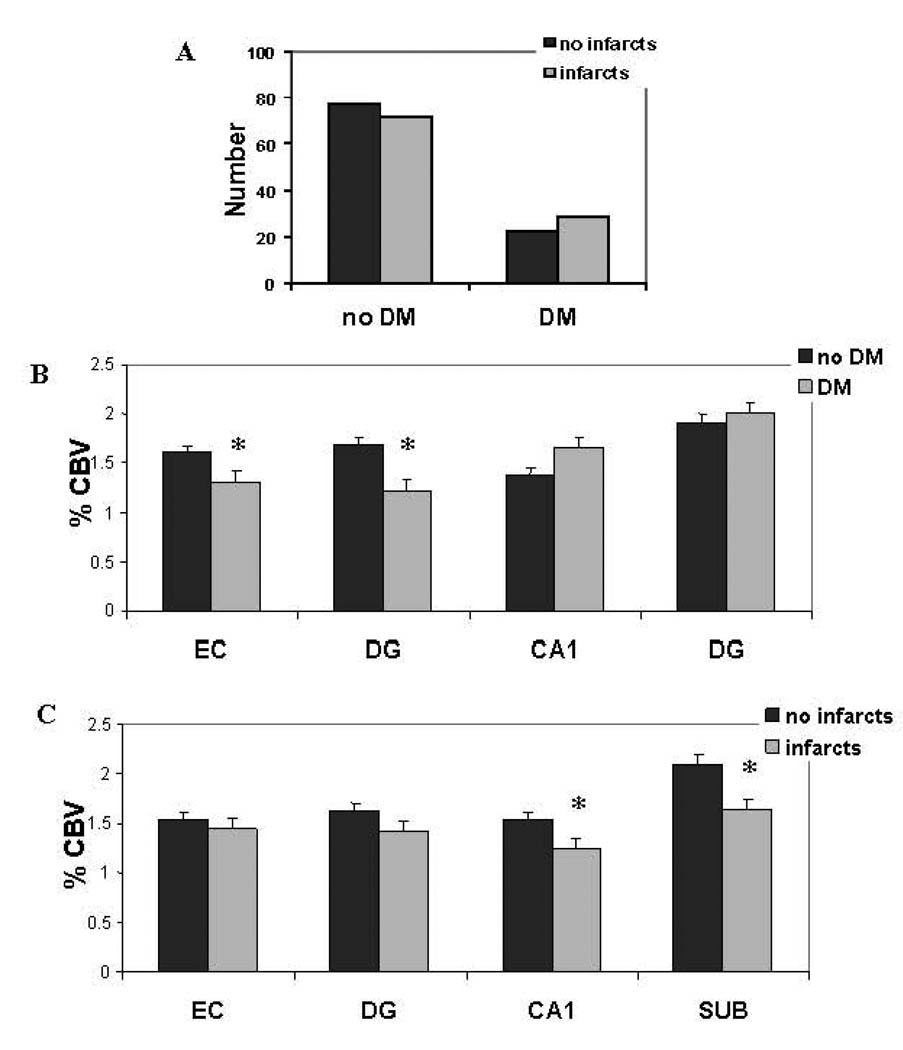
Figure 2. Diabetes and infarcts are differentially linked to separate hippocampal subregions.
A. The distribution of subjects with and without type 2 diabetes mellitus (diabetes), with and without infarcts.
B. Mean cerebral blood volume (CBV) of subjects with (gray bars) and without (black bars) diabetes across the different hippocampal subregions—the entorhinal cortex (EC), dentate gyrus (DG), CA1 subfield (CA1), and the subiculum (SUB). Compared to subjects without diabetes (no diabetes), those with diabetes (diabetes) have selective reductions in entorhinal cortex and dentate gyrus CBV (as indicated by asterisks).
C. Mean cerebral blood volume (CBV) of subjects with (gray bars) and without (black bars) infarcts across the different hippocampal subregions. Compared to subjects without infarcts, those with infarcts have selective reductions in CA1 and subiculum CBV (as indicated by asterisks).

