Figure 1.
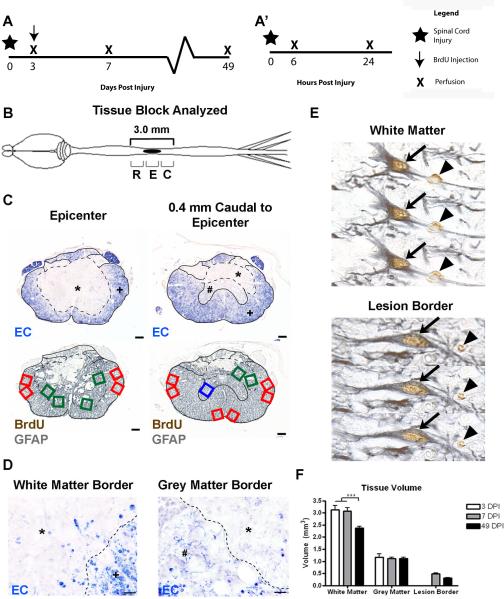
BrdU+ and BrdU+/GFAP+ cell counting paradigm. (A) Time course of the two experiments as described in the methods, showing the BrdU administration paradigm used for BrdU+/GFAP+ cell counting (A) and acute marker expression analysis (A'). (B) Schematic drawing of the CNS with a midthoracic SCI, indicated by the solid black oval. Sections were examined at 200 μm intervals from 1.4 mm rostral to 1.4 mm caudal from the lesion epicenter, and these regions were further divided into Rostral-R, Epicenter-E, and Caudal-C levels for quantitative analyses. (C) Examples of 2 pairs of transverse spinal cord sections are shown from the epicenter (left) and 0.4 mm caudal to the epicenter (right). EC staining was used to identify the distribution of the lesion edge (dashed line) and spared grey matter and spared white matter. Sample fields were counted in adjacent tissue sections stained with BrdU and GFAP antisera. Green boxes indicate lesion border areas, red boxes indicate spared white matter, and blue boxes indicate spared grey matter. * indicates the lesion, # depicts spared grey matter, and + is spared white matter. (D) High-magnification images of white matter (left) and grey matter (right) borders, with the lesion border depicted by a dashed line. (E) Examples of double-labeled BrdU+/GFAP+ cells in spared white matter (top) and lesion border (bottom), through three planes of focus. Single labeled BrdU+ cells are identified by an arrowhead, while double labeled cells are indicated by an arrow. (F) Quantification of changes in total tissue volume in different regions over time. Scale = 100 μm (C), 10 μm (D).

