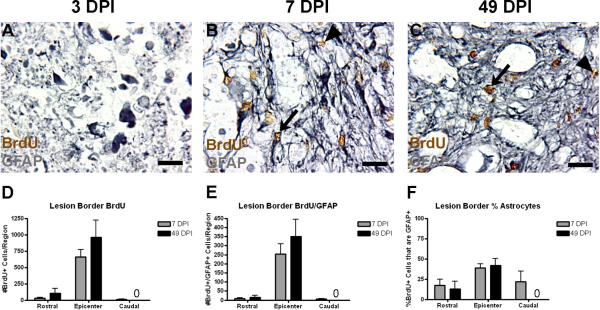
Figure 2.
Early proliferating cells accumulate at the lesion border by 7 DPI. (A–C) Representative images of lesion border regions at the injury epicenter at 3 (A), 7 (B), and 49 DPI. Examples of single and double-labeled cells are indicated by arrowheads and arrows, respectively. (D–F) Quantification of the number of BrdU+ cells (D), number of BrdU+/GFAP+ cells (E), and the percentage of BrdU+ cells also expressing GFAP (F) at 7 and 49 DPI. Cell counts were not performed for this region at 3 DPI because the region is not yet defined. “0” in graphs designate no cells in the indicated regions. Scale = 10 μm.

